This section provides tools to help gather and collate findings, and analyse user information. They can be used in isolation or collectively, depending on what your team needs.
The empathy wall is where your team's user research is downloaded and analysed.
Why have an empathy wall?
By placing everything you know about your users on the wall, it allows your team to build empathy for them while also making your work transparent and easy for your team to refer to at any time. You will generally have different types of people in different locations experiencing different or similar things. The team needs a way of collecting this information, sharing it with each other and then making sense of it. The empathy wall is a tool that allows you to do this.
When does the use of an empathy wall start?
Discovery phase - the empathy wall starts when your user research begins.
How to create an empathy wall
Step one
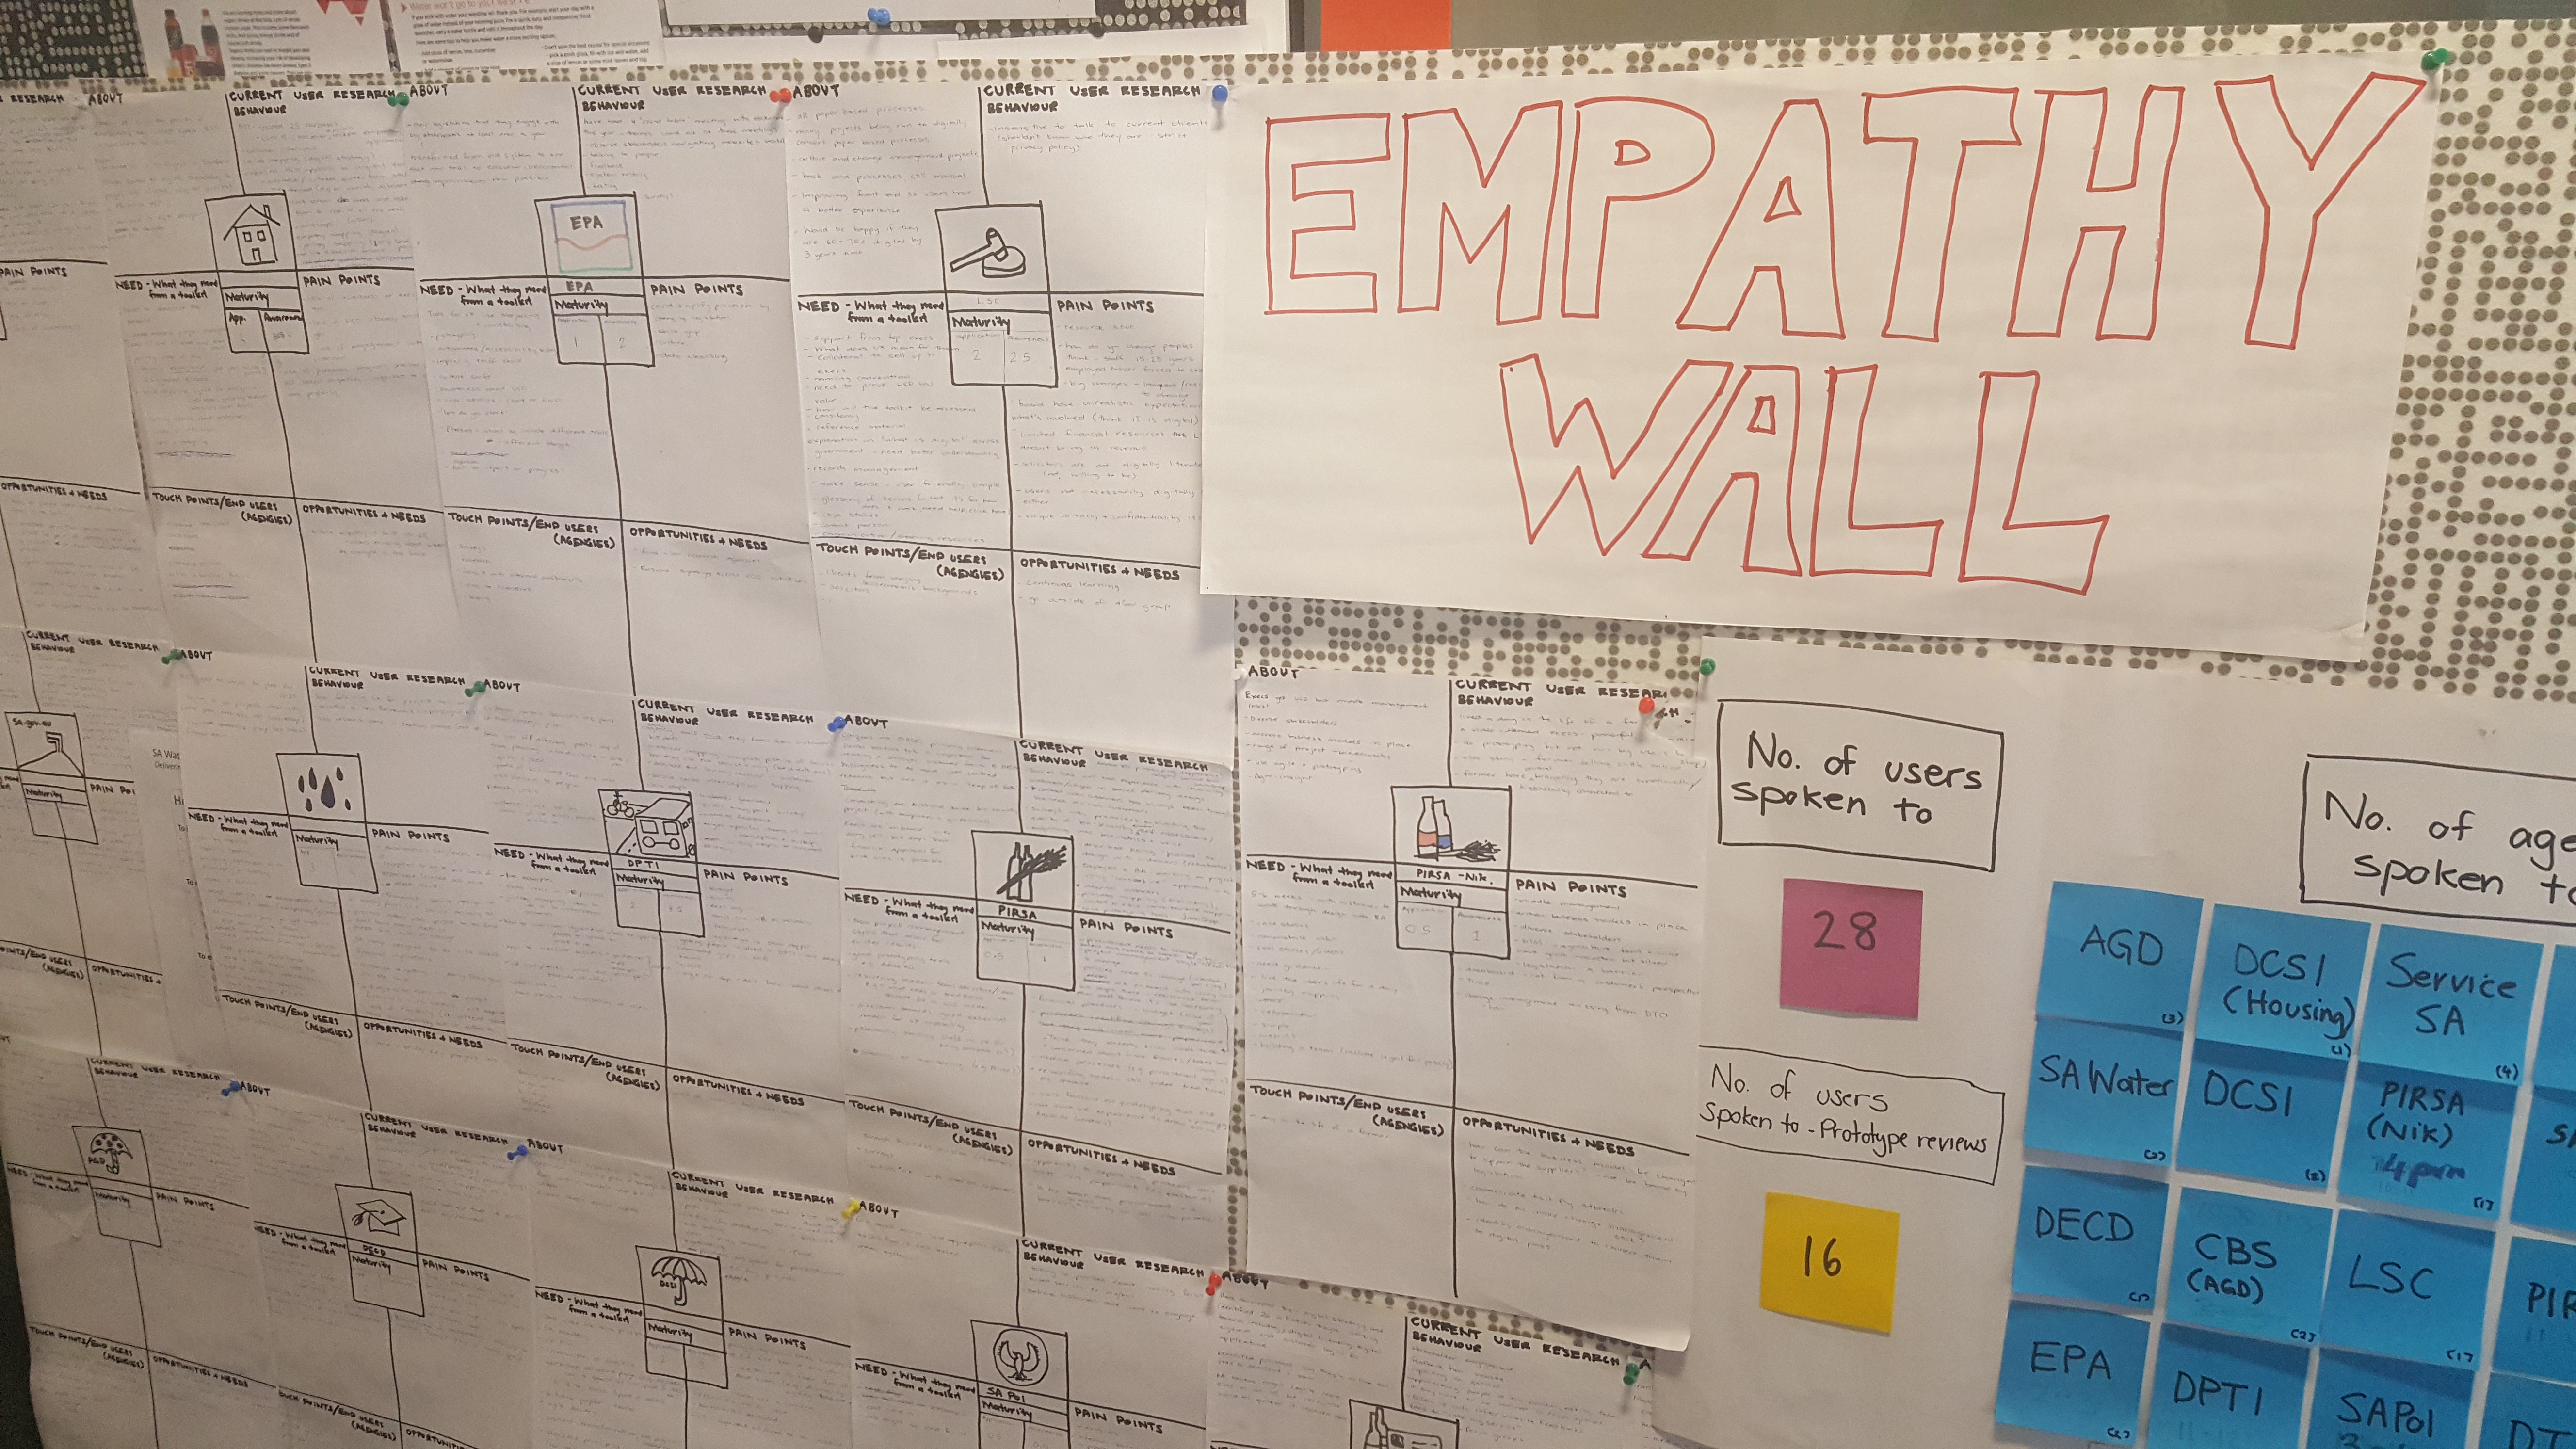
Begin by finding an empty piece of whiteboard, butchers paper or a board and label it 'Empathy wall'.
The team needs to agree on the format of the empathy sheets that collectively make up the 'Empathy wall'. These categories are recommended:
- About – who is the person you spoke to?
- Behaviour – how did/do they interact with your service (e.g. phone, online, service centre, etc.).
- Needs/tasks – what did they identify that could help improve their experience?
- Pain points – what were the difficulties (if any) that they encountered?
- Touchpoints – where has the person made contact with your and/or other government services?
- Opportunities/ideas – anything that the person you spoke to identified that could be done to improve your service.
- Image – draw to the best of your abilities an image of the person you just interviewed.
Step two
Interview your users. Co-designing requires interviewing as many users as possible.
After each interview, download what you learnt onto an empty empathy template and stick it on your 'Empathy wall'.
Step three
If you have used the journey mapping tool, this step should be familiar. Once the team has completed all the planned interviews for the day and pinned their empathy templates on the wall, each team member will take turns to discuss what was learnt. Based on these discussions, the team will use different coloured post-it notes to identify the following, which will also be pinned on the wall:
- pain points (usually pink)
- needs/tasks
- opportunities/ideas.
Step four
The analysis begins by affinity mapping your findings. Take all the pain-point post-it notes and start grouping together similar items. What will start emerging are groupings or ‘themes’. Repeat this process for needs/tasks and opportunities/ideas.
Draw a box around each grouping of post-it-notes and label them with the theme that they address. Keep a tally of how many post-it-notes address that theme.
The themes, together with the numbers will indicate a priority. The highest numbered themes generally indicate the area to explore or develop a hypothesis for.
Step five
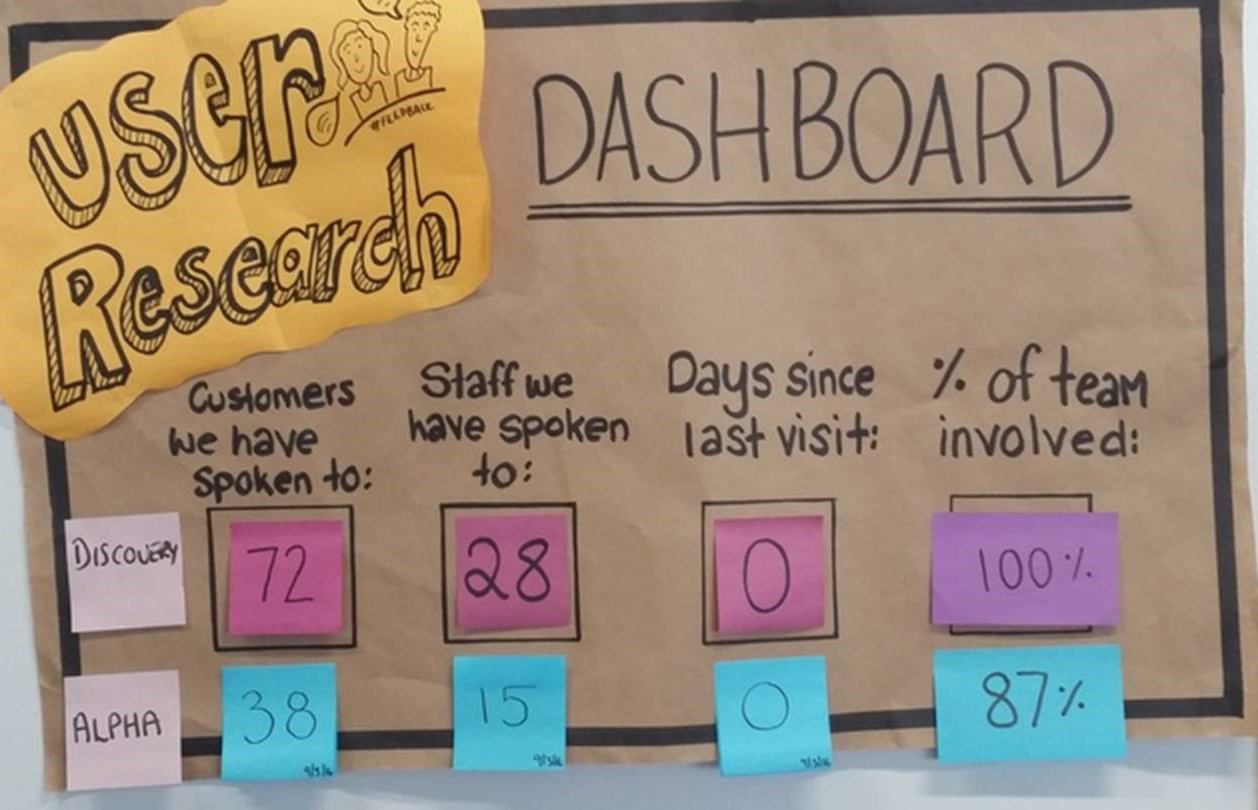
Keep a tally of the users you have spoken to by creating a dashboard with post-it-notes. This can be added to for every user you conduct research with.
Example
Templates
It is recommended that you hand draw your own empathy template. If you are not confident drawing your own, you can download our template.
User research template ((PDF, 20.7 KB))
Team skills required to create an empathy wall
Anyone can do this with the right guidance.
Stationery
Post-it-notes, markers, butcher’s paper, blue-tac, sticky dots – be creative!
A journey map is a visual representation that tells a story about the user’s relationship with a service over time and across channels - from their first contact with the service, through to their engagement across government agencies and into their ongoing relationship.
Why do journey mapping?
Creating journey maps allows the team to build empathy for the people using the service. It draws on the teams’ user research and maps out all the points where the user had contact with the service (touch points) and their experience with it. It also allows the team to identify where they can influence the chain of events.
When does journey mapping occur?
Discovery phase.
How to create a journey map
Step one
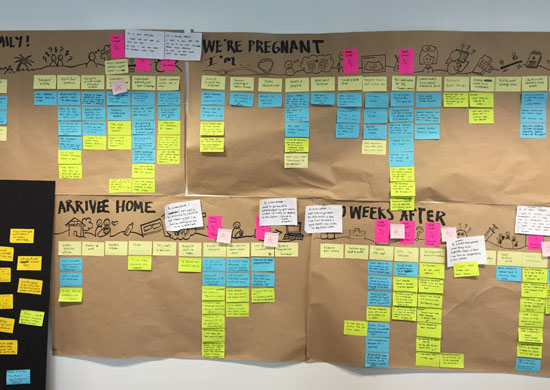
Begin by finding an empty piece of whiteboard, butcher's paper or board and label it with what your team is mapping.
Step two
Journey mapping is informed by the user research and should be kept up-to-date. Journeys need to reflect the experience of real users that you’ve met from your research and not pre-existing research. Don’t map an ideal user journey or existing business processes.
It is recommended to go as wide as possible mapping events/tasks that occur prior and after the service interaction. This helps with understanding what may cause the emotional state the user is at the time of using the service and highlight other potential transformation opportunities.
Once the team has completed all the planned interviews they will collectively map the journey their users took. This could be a daily event when the interviews are still fresh in the mind, building up the map over a period of time as you learn more about your users.
Step three
If you have used the empathy wall tool, this step should be familiar. Once the team has completed their journey map, the team (if they havent already done so through the mapping exercise) will use different coloured post-it notes to identify the following, which will all be pinned onto the map:
- pain points (usually pink)
- needs/tasks
- opportunities/ideas
Step four
The analysis begins by looking for themes. Take all the pain point post-it notes and start grouping together similar items. What will start emerging are groupings or ‘themes’. Repeat this process for needs/tasks and opportunities/ideas.
Draw a box around each grouping of post-it notes and label them with the theme that they address. Keep a tally of how many post-it notes address that theme.
The themes together with the numbers will indicate a priority. The highest numbered themes generally indicate the area to explore or develop a hypothesis for.
Step five
Keep a tally of the users you have spoken to by creating a dashboard with post-it notes. This can be added to with every user you conduct research with.
Example
Team skills needed to journey map
Anyone can do this. Having an eye for detail is helpful.
Stationery
Butcher's paper, markers, post-it notes.
Card sorting allows you to test information layouts before launching or prioritising user needs.
Why use card sorting?
Card sorting is used to understand how website users think about and organise different types of information or content. It can also be used by service teams to sort and arrange user needs.
When to use card sorting?
There are two types of card sorting - open and closed.
Open card sorts are most suitable in the Discovery phase for identifying how users think about information, in order to build an information architecture. Open means the users make their own judgement on groupings.
Closed card sorts are most suitable for validating information architecture and are best used in the Alpha phase. Closed means guidelines are provided for groupings.
How to run a card sorting session
Step one
Write the needs or topics on pieces of card (no more than 50).
Step two
Determine how you are going to target your users, online or via focus groups. 15 to 30 users are recommended - a minimum of 15 users will give reasonable confidence in the results, but any more than 30 produces diminishing returns.
Online card sorting tools are also available. They can be a cheap and effective way of reaching a large sample of users without needing to bring them into a dedicated lab facility for the study.
For an example, see the Optimal Online Card Sorting Software.
Step three
Open card sorting: ask your users to organise the cards into logical groups of their choosing. These are then given a meaningful label.
Closed card sorting: ask your users to organise the cards into a set of pre-defined groupings. The users then arrange the needs or topics into the group they believe best fits.
Step four
The aim of card sorting is to identify trends across different sessions. Look for:
- items that repeatedly appear together
- cards that your users struggle to classify
- any suggestions or new labels made
- any items put in more than one grouping
- any other items of interest brought up during the sessions.
If the majority of your users organise the cards in a similar way, then organise your information architecture accordingly. Be sure to conduct further user testing to confirm that the new structure is an improvement to the old one.
However, it’s possible that you users will come up with very different structures and complex information architectures. If this is the case, you might need to involve a larger group until broad trends emerge. It might take a few sessions until you get to a structure that works well for the majority.
Examples
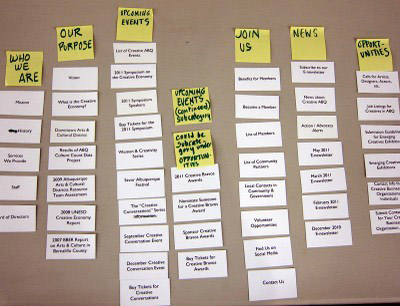
Image from Google.
Basic competencies
No specialist skills are required for this process.
Stationery
Cards, coloured markers.
To deliver an appropriate service to your customers, and for your customers to receive an experience of the service as you intend, service mapping can provide you with the current state and future state.
Why create a service map?
Choosing technology is often the most significant area of investment you’ll make when developing or maintaining your service. Your choice of technologies has a huge impact on the quality of your service and your team’s ability to operate and iterate it.
Mapping systems, data and responsible agencies against the service map will give the team a complete view of where user needs are currently being met by technology.
Understanding the existing IT systems, data stores and programs of work will give the team greater visibility into how Alpha opportunities could fit with existing technology and inform the longer-term roadmap for the service.
When to use a service map
Developed during Discovery phase, reference in Alpha and Beta phases.
How to make a service map
Step one
Choose a service or service area.
Step two
Development of the service map. There are a lot of different formats that can be used and have been provided as examples. The key areas to ensure are represented are:
- systems: what systems are used at each stage of the service
- technology: systems that are in place to provide the service
- data: what data is collected, stored and transferred at each stage of the service
- agencies: what agencies are involved in supporting the technology, data and each stage of the service.
You can highlight the specific areas of the service that you’re focussing on for Alpha, and use the map to identify potential next steps on a roadmap.
It is likely that your service map will go through several iterations - feedback from subject matter experts and stakeholders will help you improve it.
Step three
By the end of Discovery, the team should be able to answer most of these questions:
- What are the existing systems in play?
- How do they work? What technologies do they use? What are their limitations?
- Which agencies own each system?
- How do they interact with each other? Where are the dependencies?
- Are they hosted on physical hardware or using cloud providers?
- Who currently maintains each system?
- What capabilities do these teams have?
- What are the disaster recovery and backup processes in place?
- How often are changes released? What are the release and deployment processes?
- What’s the short, mid and long-term plans for each system?
When exploring the flow of data between systems, the team should consider:
- What information is being stored?
- Where are the canonical sources of data? Where is data duplicated between systems?
- What is the data quality like? Where are there gaps in information?
- Where does data enter the process?
- What are the security and privacy considerations around the data?
- In what format is the data stored? Does the data follow any international standards?
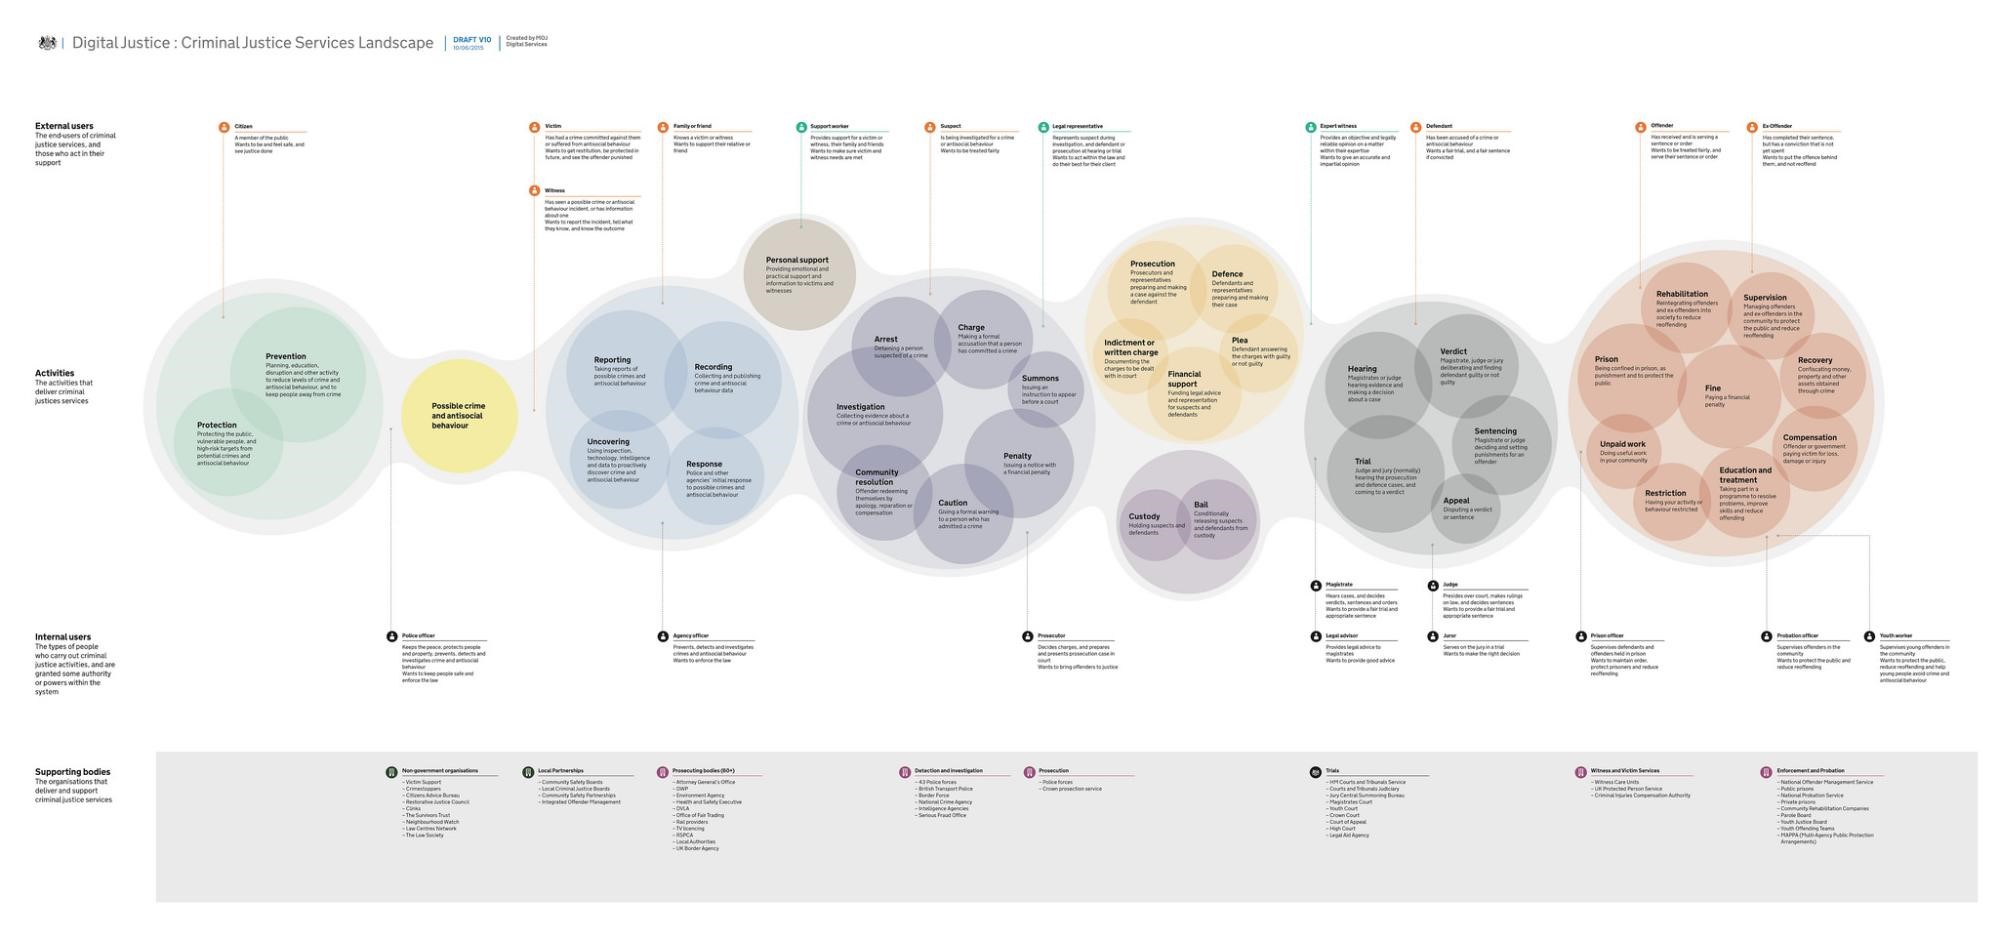
Example
For other examples of service maps, open the attached:
Criminal justice service map ((JPG, 151.1 KB))
Basic government idealised journey service map ((PNG, 301.6 KB))
Team skills needed to create a service map
Team members will need skills in attention to detail, and the ability to analyse data and information.
Service mapping is generally performed by a business analyst.
Stationery
Post-it notes, markers, butcher's paper, blu-tac and sticky dots are useful.
User stories are an essential part of the agile toolkit. They’re a way of organising user requirements into manageable chunks that create tangible value, and can be discussed and prioritised independently. They are not specific to the technology.
A user story is a brief statement that explains:
- who the user of the service is (as a <user>)
- the task that they are completing (I need ...)
- what they are trying to achieve (so that I <goal>).
Why create user stories?
The benefits of defining user stories are that they:
- can be written by anyone
- capture insights
- evoke empathy for the user
- can pack a lot of information into a small package
- are an achievable unit of work that is measurable and ‘tickable’
- are a reality check
- can be understood by users too
- provide a shared understanding.
How to define user stories?
Step one
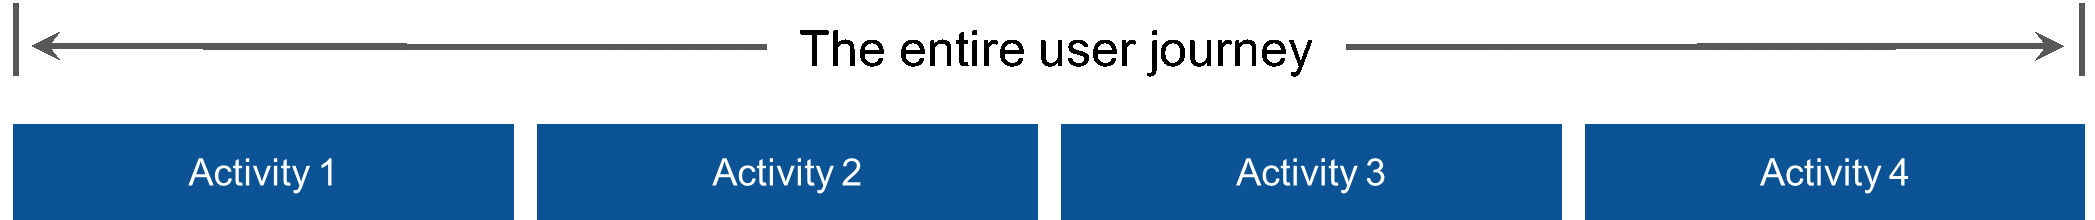
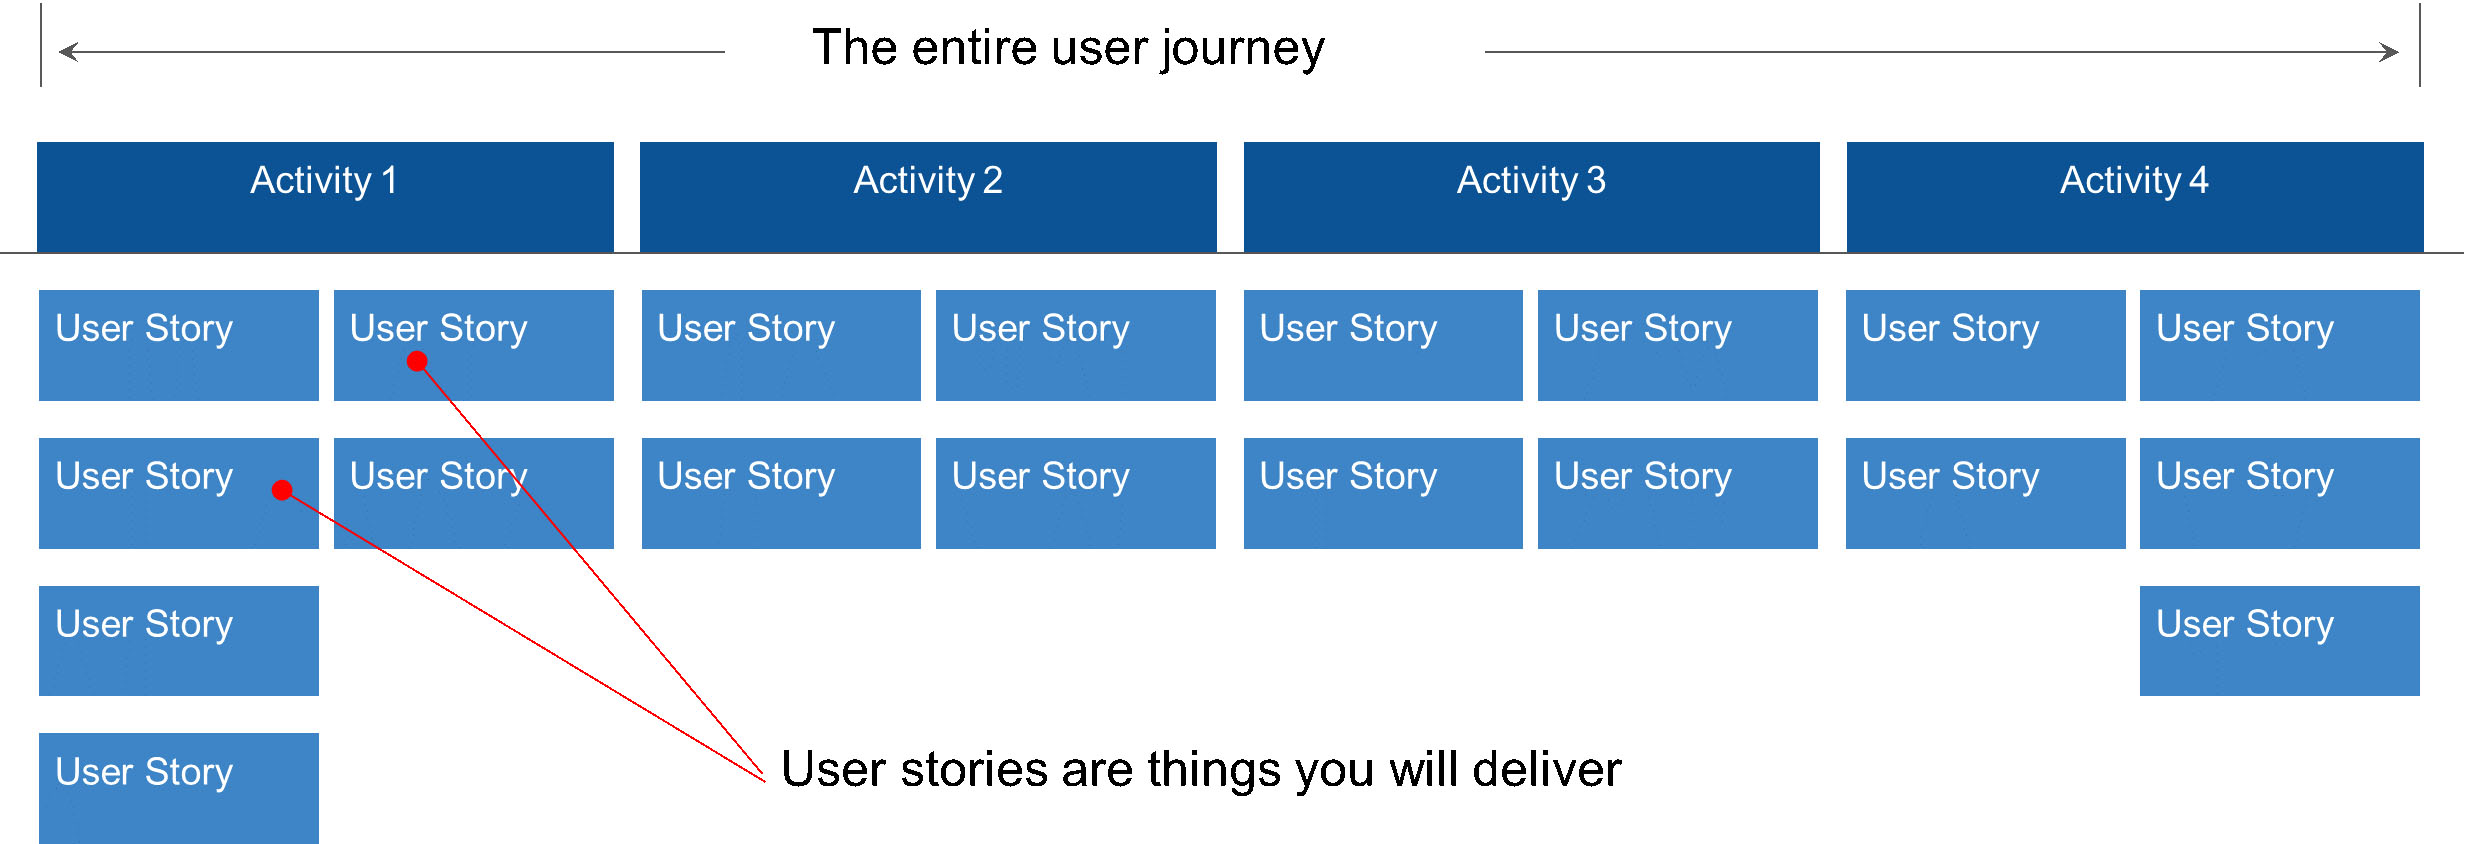
Start building your user story map by writing out your story one activity at a time. Starting from left to right until you have all the activities that complete the goal. Focus on the breadth of the story before diving into the depth. For example:
Step two
Under each activity, list the tasks as user stories required to complete the activity. Stack the user stories vertically from compulsory to optional. When you begin this process you may find that some user stories seem extremely large, these are commonly known as an ‘epic’ and need to be broken down further.
Consider alternative tasks/user stories in the journey. For example, what if something unexpected happens? You might think of them as 'what if?' stories.
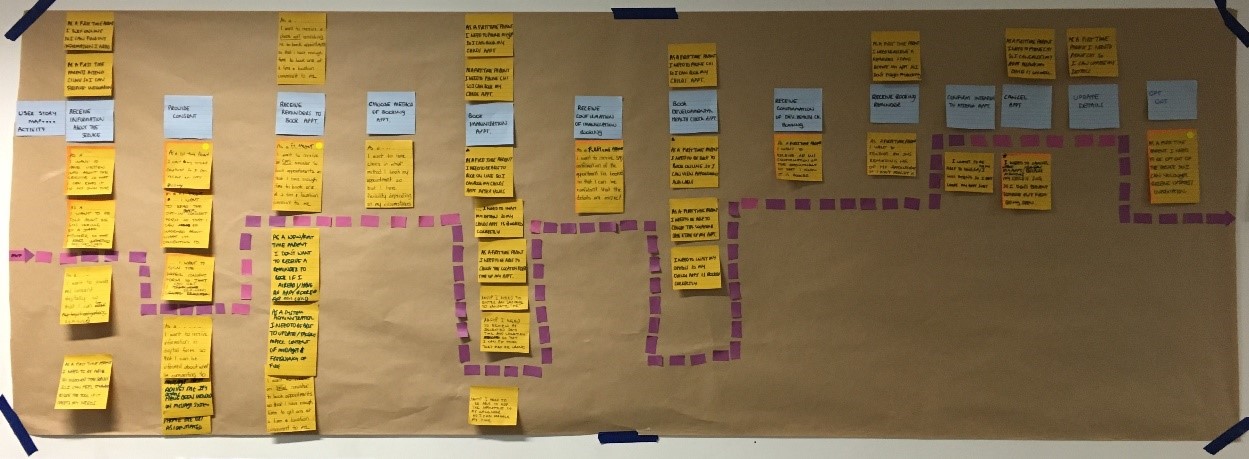
For example an activity might be: Receive reminders to book an appointment.
A user story for this activity might be: "As a parent I need to receive a SMS reminder to book appointments so that I can have enough time to book one at a location close to me."
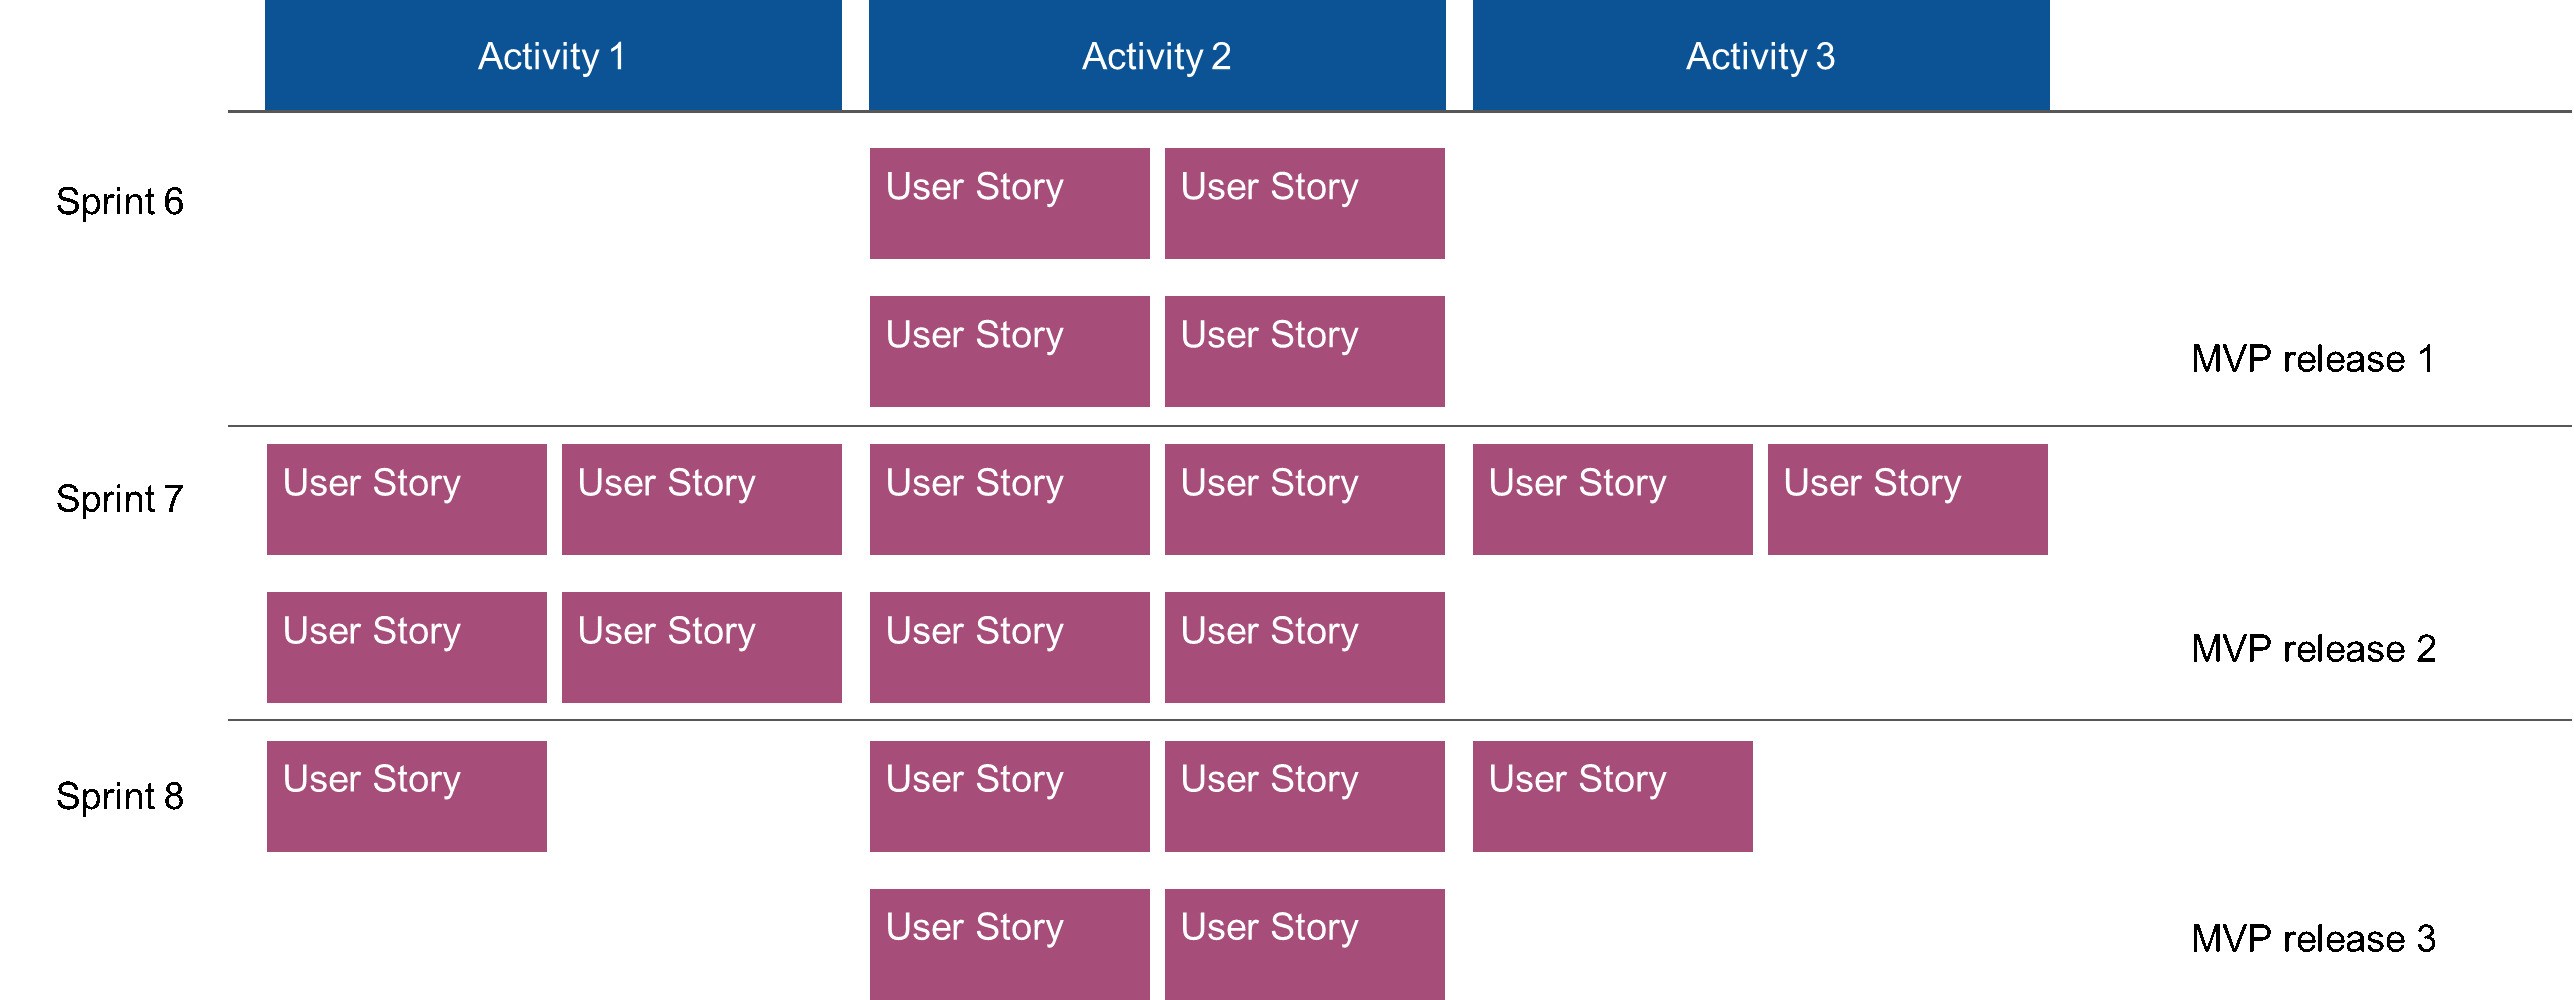
This is a story map with user stories.
Step three
Once all the activities and user stories are drafted it is time for your team to prioritise according to the users’ perspective. These need to be ordered by listing the first thing the user needs to do to complete the activity, followed by the second, third, etc. Prioritising is a good, better, best game - identifying what must be done, what should be done, what could be done, and what will be considered in the future.
Step four
Draw a line separating the must, should, could and future. It is normal for new user stories to be identified as you progress. These simply get added to the product backlog and prioritised against those already present. It will be up to the team to determine what happens with these new user stories in comparison to the existing (already prioritised) ones.
You should keep your user stories visible and accessible to the team to continually remind you about ‘what the users want’. A good way to do this is via a physical Kanban board in a high traffic area.
Step five
Arrange the user stories into sprints in order to form the minimum viable product. This can be done during the planning session of each sprint. It might be worthwhile taking some time to forecast which sprint user stories might be developed to ensure all prioritised stories can be addressed within the allocated time.
Team skills needed to define user stories
An understanding of agile and defining user stories. The digital/business transformation manager will guide you through this process.
Stationery
Butcher's paper, markers, post-it notes.